The Ichimoku trading system is one of the best tools for traders. Originated in Japan, it revolutionizes the way traders perceive the financial markets. It provides so much depth with regard to market trends and where to find trading opportunities in forex and stocks.
The Ichimoku Cloud is for those who want more advanced tools. It graphically depicts the market trend. This tool makes it easier to find key levels and changes in market momentum for the trader.
This guide will dive in deep with the Ichimoku Cloud system to help traders find new ways in looking at the markets to make better decisions.
Key Takeaways
- Advanced technical analysis tool originating from Japan
- Comprehensive pictorial representation of market trends
- Applicable to more than one financial market.
- It gives the insights about trend direction and momentum.
- Offers advanced but intuitive trading indicators
Table of Content
- The Ichimoku Cloud Trading System: How to Understand It
- Origins and Development of Ichimoku Kinko Hyo
- Core Components of the Cloud System
- Reading Cloud Formations and Signals
- Key Of Ichimoku Indicators and Their Calculations
- Conclusion
- FAQ
- What is the Ichimoku Cloud?
- How many components does Ichimoku Cloud have?
- Does Ichimoku Cloud suit every kind of trade?
- How does the color of the cloud mean to the traders?
- In which markets does the Ichimoku Cloud study work best?
- Can beginners learn and use the Ichimoku Cloud system?
- What time frames does Ichimoku Cloud trading work best with?
- How does Ichimoku Cloud vary from a regular moving average?
- What are the major limitations of the Ichimoku Cloud system?
- How often does a trader have to change his Ichimoku Cloud settings?
The Ichimoku Cloud Trading System: How to Understand It
The Ichimoku Kinko Hyo is a very complex Japanese charting technique. It revolutionized the way traders looked at price action. It is a trend-following technique that provides an above-average market view with excellent detection of market tendencies.
Origins and Development of Ichimoku Kinko Hyo
It was created in the late 1930s by a Japanese journalist named Goichi Hosoda after years of studying markets. He wanted to create something that would be able to convey all information in a glance.
“A chart is worth a thousand words” Goichi Hosoda
Core Components of the Cloud System
The Ichimoku Kinko Hyo consists of five main parts. They help in comprehending the movements of the market.
- Tenkan-sen (Conversion Line): It displays the short-term trend of prices.
- Kijun-sen (Base Line): Gives medium-term trends
- Chikou Span: The lagging span plots the current closing price against past price action.
- Senkou Span A: Forecasts future support and resistance
- Senkou Span B: Defines the edges of the cloud
Reading Cloud Formations and Signals
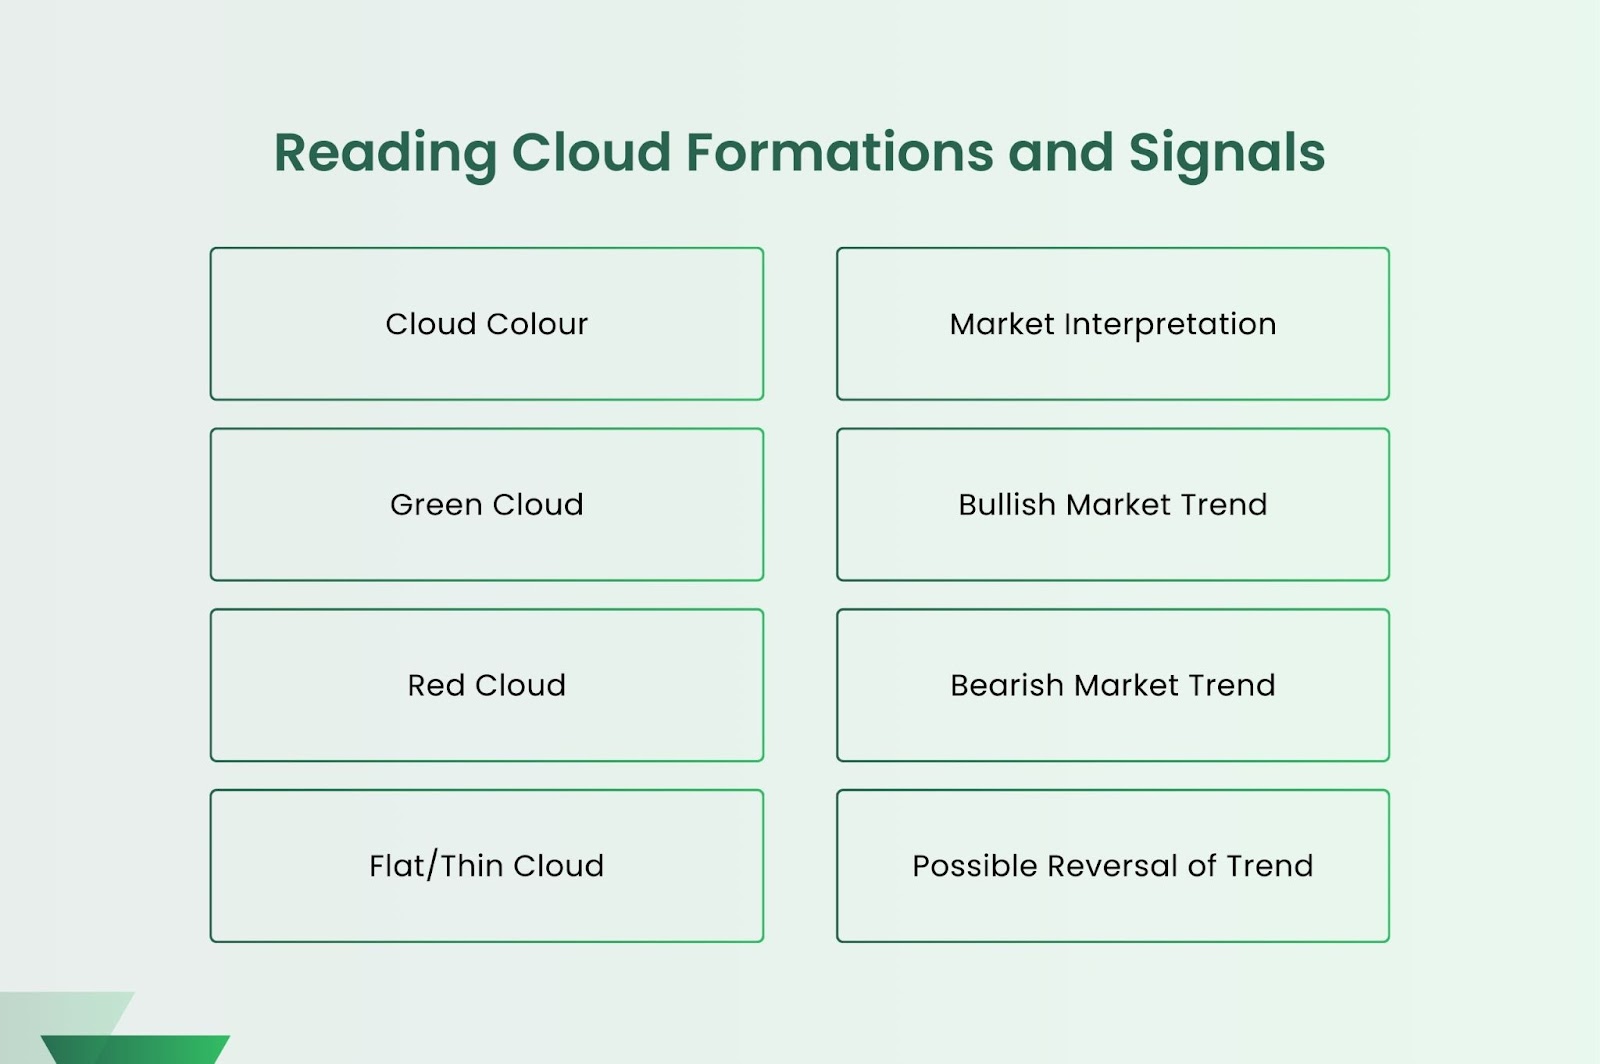
The key to this is in understanding the formations of clouds. The traders consider the color of the cloud, its thickness, and its position for this very reason, enabling them to see the market trends and find trading chances.
| Cloud Colour | Market Interpretation |
| Green Cloud | Bullish Market Trend |
| Red Cloud | Bearish Market Trend |
| Flat/Thin Cloud | Possible Reversal of Trend |
Learning these parts helps traders use advanced strategies; it’s much more than just looking at charts.
Key Of Ichimoku Indicators and Their Calculations
The Ichimoku Cloud system is one of the most detailed ways of market analysis. It consists of five main indicators that give the trader a profound insight. These indicators are different from simple moving averages and show more about price movements and market strength.
- Tenkan-sen: This depicts the short-term price momentum.
- Kijun-sen: It defines the medium-term trend.
- Chikou Span: Confirms the trend’s strength.
- Senkou Span A: Creates the cloud’s leading edge
- Senkou Span B: Completes the formation of the cloud
These indicators are calculated differently from the usual moving averages, as the Tenkan-sen and Kijun-sen take into consideration specific price periods. This makes them more dynamic than traditional methods.
“Ichimoku Cloud transforms the price data into a complete visual of market dynamics.” – Ichimoku Technical Analysis Expert
With this indicators, traders understand the perplexing market movements. Seeing how they interact and positioned gives a full view from market trends to changes to the traders.
| Indicator | Calculation Period | Primary Function |
| Tenkan-sen | 9-period | Short-term momentum |
| Kijun-sen | 26-period | Medium-term trend direction |
| Senkou Span A | Leading indicator | Cloud formation prediction |
| Senkou Span B | Leading indicator | Cloud boundary establishment |
| Chikou Span | Lagging indicator | Trend confirmation |
These indicators take some getting used to, and understanding them requires practice and time. Traders must also invest time in learning how they interact with one another and what their subtle signs and signals mean.
Trading Strategies Using Cloud Analysis
The Ichimoku Cloud is an advanced analytical tool that traders can use to enhance their performance in the market. This system offers detailed methods for analyzing trends and managing trades in various markets.
Trend Direction and Strength Assessment
Ichimoku Cloud analysis makes understanding market trends easy. The trend strength can easily be viewed in:
- Price position relative to the cloud
- Cloud color and thickness
- Conversion and base line interactions
Entry and Exit Point Identification
Successful breakout trading requires the Ichimoku Cloud to provide clear support and resistance levels. The optimal entry and exit points can be determined by:
- Cloud boundary crossovers
- Conversion and base line signals
- Lagging line confirmations
Cloud Risk Management with Boundaries
The boundaries of the Ichimoku Cloud provide for very straightforward and effective stop-loss placement. Traders can manage risk quite well by:
| Strategy | Risk Mitigation Technique |
| Bullish Trend | Stop-loss to be placed below cloud support |
| Bearish Trend | Place stop-loss above cloud resistance |
| Neutral Trend | Leverage Cloud Edges for Dynamic Protection |
“The Ichimoku Cloud takes some very complex market dynamics and simplifies them into a clear, actionable trading insight.” – Professional Trader
Such strategies take time and practice to master, with deep understanding of the subtle messages of the Ichimoku Cloud.
Advanced Cloud Pattern Recognition
It reflects in greater detail the advanced Ichimoku Cloud pattern recognition trader who seeks deep insights while making a trade. Moving beyond simple cloud reading for detailed analysis in accurate decision-making in trading.
- Kumo breakouts signal possible changes in trend.
- Kijun-sen crossovers show moments of momentum shifts
- Time-shifted patterns uncover hidden market moves
Application across multi-timeframes is the technique in spotting complex cloud patterns. Traders find the hidden signals by looking at multiple time scales of patterns in search of signals to trade. Divergence trading enhances this further due to a comparison of price actions against indicator signals.
“Advanced pattern recognition truly changes technical analysis from one of reactive to proactive strategies.” – Professional Trading Analyst
Other significant sophisticated pattern recognition strategies involve:
- Examining how the cloud components interact
- Spotting complex momentum changes
- Finding early signs of reversals in trends
Successful traders are known to use these advanced techniques. They formulate detailed trading strategies beyond basic market analyses.
Conclusion
It takes a lot of hard work and learning to continuously improve Ichimoku trading. There is much more for the trader to learn than how to read charts. The Ichimoku Cloud system will greatly help in understanding the market, but one must put in the effort to practice, for it is then alone that adaptation and evolution can take place.
The ability to adapt to the market is one of the most important features in trading well. Good traders know very well that no one method can be sustained for long, so they keep perfecting the Ichimoku Cloud in trading. In addition, every investor needs to adapt themselves with respect to a shifting market.
Trading psychology plays a very important role, too: the trader has to control his emotions, manage risks competently, and make clear decisions. Although knowing how the Ichimoku Cloud works is more than enough to use it well, it also requires mental strength and smart thinking.
It is actually a journey: a journey of improving yourself towards mastery of Ichimoku Cloud. Only the traders who invest the time in learning its intricacies, practice a great deal, and are always open to new ideas tend to do well. The former will use this potent tool at their behest for investment decisions.
FAQ
What is the Ichimoku Cloud?
The Ichimoku Cloud is a market analysis tool developed by Goichi Hosoda. It serves to help traders visualize market trends, resistances, supports, and signals that may occur within any marketplace, such as forex or stock markets.
How many components does Ichimoku Cloud have?
The Ichimoku Cloud comprises five components: Tenkan-sen, Kijun-sen, Chikou Span, Senkou Span A, and Senkou Span B. These together give a completive picture of the market trends and price movements.
Does Ichimoku Cloud suit every kind of trade?
The Ichimoku Cloud is a good trend follower. The one-directional moving market is where it works, and traders are meant to adjust it according to the different time frames, thus making decisions using it together with other tools.
How does the color of the cloud mean to the traders?
The color of the cloud shows market mood: green – market is up, and red – it’s down. The thickness and the position of the cloud may give a hint at possible levels of support and resistance.
In which markets does the Ichimoku Cloud study work best?
It is best for liquid markets, such as forex and major stocks. It works well where there is enough trading and clear trends.
Can beginners learn and use the Ichimoku Cloud system?
It is learnable with practice by even beginners. First, have a look at the charts and paper trade before using actual money.
What time frames does Ichimoku Cloud trading work best with?
Daily and weekly charts give the best signals. But you can use it on any time frame, from 1-hour to monthly charts.
How does Ichimoku Cloud vary from a regular moving average?
It is more insightful into the market, with the use of forward-looking indicators and considerations for different time periods. It gives more detailed signs about trends and reversals.
What are the major limitations of the Ichimoku Cloud system?
It sometimes gives false signals in highly volatile markets. It can be used with other tools in combination along with fundamental analysis and along with risk management to create better results.
How often does a trader have to change his Ichimoku Cloud settings?
Adjust the settings in accordance with the market and your trading instrument. For most, the default setting of 9, 26, 52 will be appropriate, but it needs to be reviewed over time.