In the fast-moving world of financial markets, traders and investors are always in pursuit of an edge. The moving average has proved its worth as a fundamental tool. It helps traders make better decisions by clearly depicting market trends.
These moving averages essentially help in identifying the trend for the purpose of a trade by showing the mean security price over time, hence informing the traders of the market feelings as well as identifying key levels of support or resistance.
It can include fluctuating graphs, arrows for upward and downward trends, using various financial indicators in sleek graphing. A palette of blue and green colors will give it that technological and financial look; add to that smooth gradients and abstract shapes.
This guide will deeply explore moving averages. We are going to cover the basics of the moving average, types of moving averages, and exactly how to use them in order to gain an advantage in your trade. From the most professional to complete beginners, this article is going to walk you through mastering moving averages in trading with guaranteed success.
Key Takeaways
- Moving averages are one of the strongest tools in the technical analysis repertoire that may be used as an assistant in defining market trends or producing a trading signal.
- First off, there are a couple different kinds of moving averages that exist, all having their characteristic and application.
- An understanding of the mathematics of moving averages yields a better overview of its behavior and hence interpretation.
- It is of most importance to align the timing of moving averages with the correct trading style and prevailing market conditions.
- Mastering a moving average will surely give you an added advantage in the financial markets.
Table Of Contents
- Moving Averages Trading Fundamentals
- Simple vs. Exponential Moving Averages
- Multiple Moving Average Systems
- Price Action Analysis with Moving Averages
- Common Moving Average Trading Mistakes to Avoid
- Conclusion
- FAQ
- What is a moving average?
- What are the various types of moving averages?
- What ways does the moving average come into play in technical analysis?
- What is the significance of different time periods in moving averages?
- How are the traders using the moving average crossover patterns?
- What are the typical errors a trader makes when trying to use moving averages?
Moving Averages Trading Fundamentals
Financial markets are always in a flux, and at the roots of such change lie moving averages. The moving average is a tool that helps traders by drawing out the trend of the market, hence assisting them to make more informed decisions. We will touch on some very basic aspects of moving averages, including Simple Moving Averages and Exponential Moving Averages. We’ll dive further into their mathematics and why different time periods make a difference.
The Math Behind Moving Averages
A moving average is determined by an addition of a certain amount of values within a specific range divided by the total of items within that range. Within the formula for EMA, a weighted average can be placed to give recent data greater importance. With these data weights, the EMA provides indications, as a result of being one of the more lagging kinds of indicators that would otherwise have been obtuse from simply pure market trend analysis.
Simple vs. Exponential Moving Averages
The two major moving averages on which the traders rely include the SMA and EMA. While the SMA gives an equal weight to all data points, the EMA gives more weight to the recent data. Because of this, it is more responsive to market shifts.
Time Periods and Their Importance
The time span chosen for a moving average is a matter of vital importance. It does affect the sensitive and reliable aspects of an indicator. Shorter periods include 9-day or 12-day SMAs and EMAs, which effectively catch up with recent changes in the market. This is good for defining shorter-term trends. Longer periods, going as high as the 200-day SMA or EMA, give a higher view of the market trend analysis.
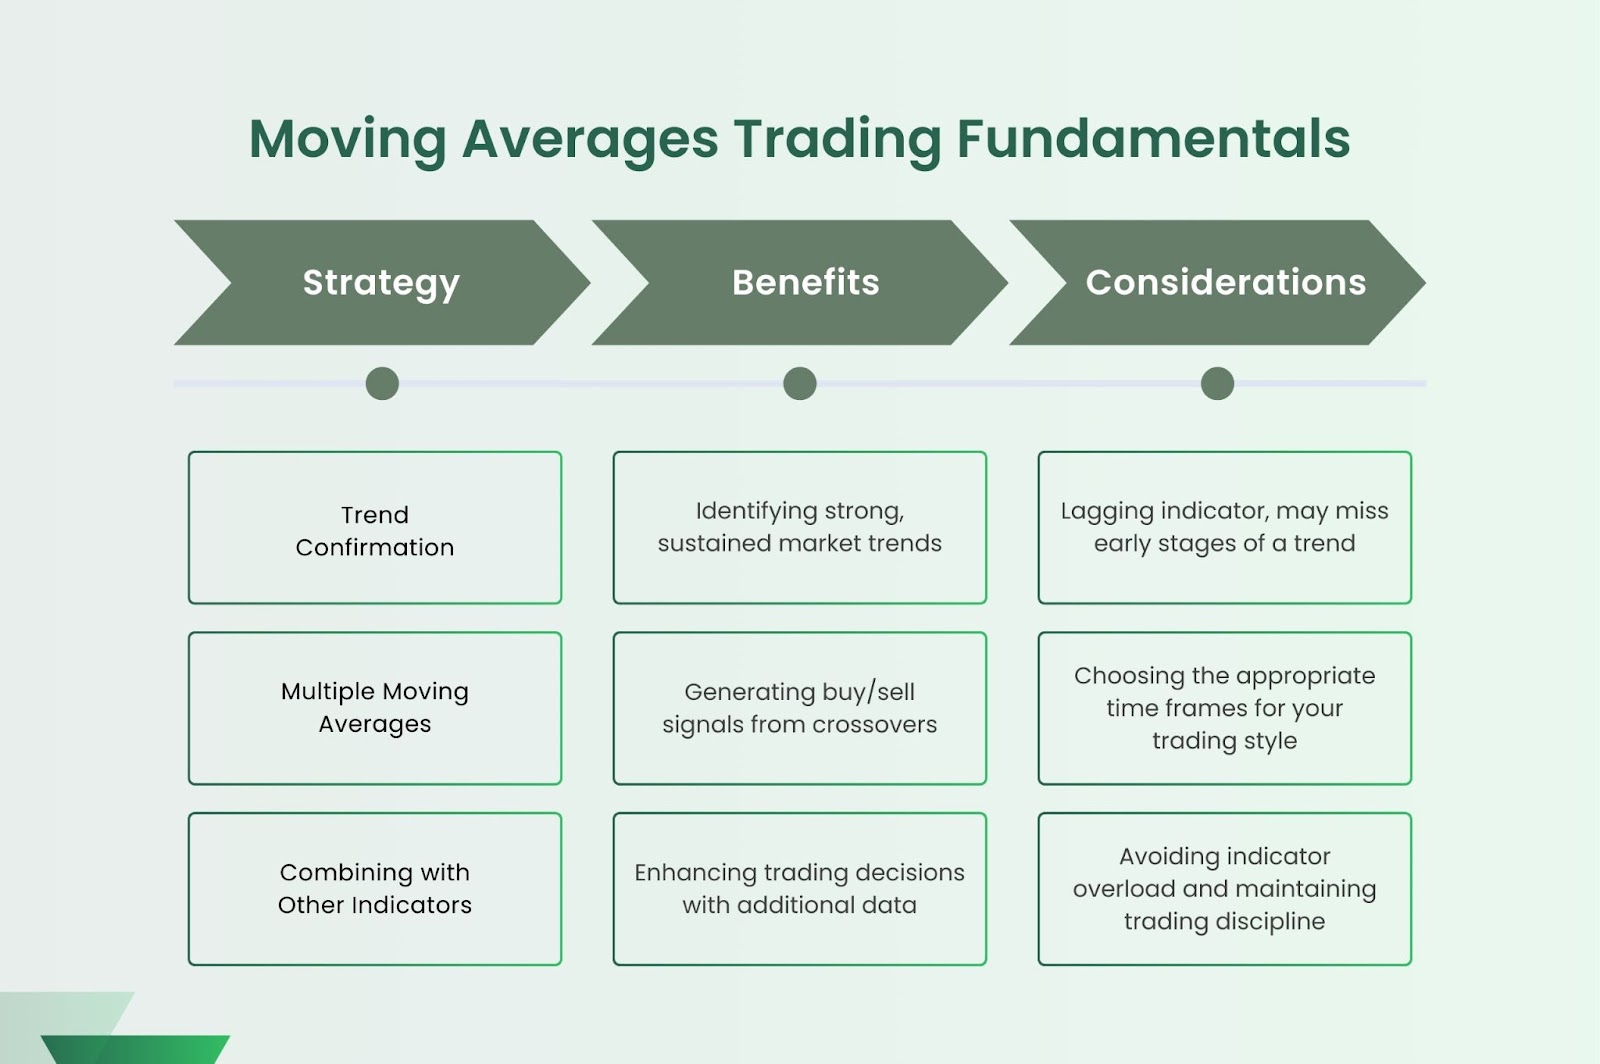
| Moving Average Strategy | Potential Benefits | Considerations |
| Trend Confirmation | Identifying strong, sustained market trends | Lagging indicator, may miss early stages of a trend |
| Multiple Moving Averages | Generating buy/sell signals from crossovers | Choosing the appropriate time frames for your trading style |
| Combining with Other Indicators | Enhancing trading decisions with additional data | Avoiding indicator overload and maintaining trading discipline |
Well, moving averages are probably the most powerful tools that any trader can use. Moving averages give a very great insight into the trend in the market and help the identification of potential buying and selling opportunities.
Golden Cross and Death Cross Signals
The Golden Cross occurs when a shorter-term moving average crosses above the longer term. This is one of those bullish crossover strategies that depict a probable market reversal upward. In contrast, when the 50-day MA falls below the 200-day, this situation is known as the Death Cross. It is a bearish signal and indicates the downturn in a market.
Multiple Moving Average Systems
The smart trader resorts to several moving average systems for more productive trading signals. They mix different time frames, like the 20-day, 50-day, and 200-day moving averages, into one system to easily recognize complex crossover patterns and finally catch a glimpse into the trends that will help their trade grow.
Price Action Analysis with Moving Averages
Traders also use moving average analysis together with price action analysis. They notice how price moves with moving averages. This helps them in finding support and resistance levels, trend lines, and other technical patterns responsible for predicting future market reversals.
This forms the learning about moving average crossover patterns that help in improving trade skills and will have better preparation for success in variable market conditions.
Common Moving Average Trading Mistakes to Avoid
Moving averages are widely used by traders because of their simplicity and perceived reliability. However, relying too much on them may result in some problems, such as fake signals and overtrading. Let’s analyze the most common mistakes traders make when using moving averages in their trading strategy. Probably one big mistake that has been made is confirmation bias, where traders rely a great deal on the signals provided by moving averages alone without considering other significant market factors.
This often can result in false signals and wrong trading decisions. Another mistake is overtrading. The traders react too fast to each change of a moving average, which results in great costs and stress. One needs to find a balance between acting quickly and being patient enough to wait for a clear signal to trade. Last but not least, traders should avoid curve fitting. That means trying to manipulate moving average settings to fit a pattern on historical data. Sure, it looks good in theory, but most often fails in real-world markets and results in disappointment and loss.
“The art of trading lies not in getting caught by the false signals and noise but in focusing on the underlying trends and fundamentals.”
By being aware of these common pitfalls, a more disciplined approach to trading with moving averages can be utilized by traders in maximizing this tool for better market success.
| Mistake | Description | Impact |
| Confirmation Bias | Focusing solely on moving average signals and ignoring other market factors | Leads to false signals and erroneous trading decisions |
| Overtrading | Becoming overly responsive to every moving average crossover or trend change | Excessive transaction costs and emotional strain |
| Curve Fitting | Optimizing moving average parameters to fit historical data, but failing to translate into real-world conditions | Disappointment and losses when the strategy underperforms in live trading |
Conclusion
Mastering the moving averages trading technique opens all the success doors. In the most general sense, it coaches traders in India on how to confidently surf up and down in the stock markets. Understanding the essentials, strategies, and certain mistakes usually made will make it very easy.
Success in trading is all about learning and adapting. A trader should never stop enhancing the moving average skill continuously. This is how they can maintain their lead in this ever-changing market.
Becoming a successful moving average trader is a lifetime process. Be faithful, practice often, and take on the challenges. Keep learning and perfecting your skills for financial freedom.
FAQ
What is a moving average?
The moving average is a tool of finance that maps the average stock price over a period, which helps in identifying the trend and hence making the trading decisions.
What are the various types of moving averages?
The two most common are the Simple Moving Average, or SMA; and the Exponential Moving Average, or EMA. SMAs treat each piece of data with equal importance. EMAs give greater importance to more recent prices, thereby making them quicker to adjust to changes in price.
What ways does the moving average come into play in technical analysis?
Moving averages are usually the mainstay of technical analyses. It helps traders represent the trend, make the right decision to buy and sell, and check the pulse of the market. Complementing them with various other indicators will result in a great trading plan for sure.
What is the significance of different time periods in moving averages?
The period used to calculate the moving average determines its sensitivity: the shorter the period-used, perhaps 10-day or 20-day-a moving average captures very quick changes in price. The longer-term average-for example, the 50-day, or 200-day-reveals major trends.
How are the traders using the moving average crossover patterns?
Crossovers in moving averages are an example of what traders will track. The Golden Cross means a shorter-term above the longer-term and a Death Cross when the short term falls below the long. Those signals are both sell or buy signals.
What are the typical errors a trader makes when trying to use moving averages?
The biggest mistakes most traders make are either putting too much emphasis on a single moving average or not taking into consideration other market signals whatsoever. Some might even overtrade in the wake of what the moving average signal dictation is. It’s very important that you only use moving averages together with other tools, without tilting the balance to any particular extreme.