The market is like a maze for any trader; so many indicators and strategies are there to choose from. However, over these years, one indicator has proved its worth: Bollinger Bands. They were created by John Bollinger in the 1980s.
These bands are crucial for traders operating in stocks, forex, and cryptocurrencies. They show the volatility of the market and any changes in the trend. They also portray the times when prices are overbought or oversold.
Bollinger Bands offer a different look at the market’s movements. This will help traders make better decisions, which can further lead to more confidence in trading.
Key Takeaways
- Bollinger Bands are a technical analysis tool developed by John Bollinger in the 1980s.
- These tools assist traders in identifying market volatility, possible reversals in a trend, and overbought/oversold conditions.
- In practice, over time, the Bollinger Bands have been applied to almost all financial markets, ranging from stocks to forex to cryptocurrencies.
- These bands provide a dynamic price channel that gives a further dimension in market dynamics.
- The core concept and different components involved in Bollinger Bands are the vital variables that a trader must progress further into the decision-making framework.
A colorful, abstract representation of Bollinger Bands overlaid onto a financial chart, fluctuating in price movements inside two curved lines, in colors such as blue and green, into intricate patterns resembling market trends, on a dynamic background symbolic of volatility and opportunity.
Include subtle elements that reflect a sense of analysis and strategy. The overall composition should be harmonious and catch the eye, reflecting the essence of trading and market dynamics. The brand name “Smart Delta” should be subtly included in the design.
Table of Contents
Understanding Bollinger Bands: Core Concepts and Components
Bollinger Bands are among the most important tools used in technical analysis. The bands let traders get insight into the volatility and flow of prices within an underlying market. The tool consists of three lines: a middle simple moving average, and the upper and lower bands.
The Three Lines: Middle SMA and Upper/Lower Bands
The middle line is the simple moving average of the asset’s price over 20 days. The upper and lower bands are set two standard deviations away from the SMA line.
Standard Deviation and Measurement of Volatility
The separation of the bands represents the volatility of the asset. When bands are narrow, it means a low volatility, while the wide bands depict high volatility. Standard deviation measures this band width, depicting price swings.
Time Periods and Band Width Importance
The period that one chooses for Bollinger Bands defines what it means. Shorter periods, like 10-day or 15-day periods, reflect short-term movements in prices. Longer-period ones, such as 50- or 100-day, reflect broader market trends.
Knowing Bollinger Bands well helps traders make better choices, which then leads to better trading results.
How Bollinger Bands Calculate Market Volatility
Bollinger Bands are a main tool in technical analysis for measuring and understanding volatility. It is a statistical approach used to understand price action, as well as market trend determination.
Bollinger Bands are a standard deviation-based creation. This is essentially a volatility measure showing how much prices are deviating. That is, on the backbone of the standard deviation in prices over time, Bollinger Bands draw bands dynamically changing around a middle line.
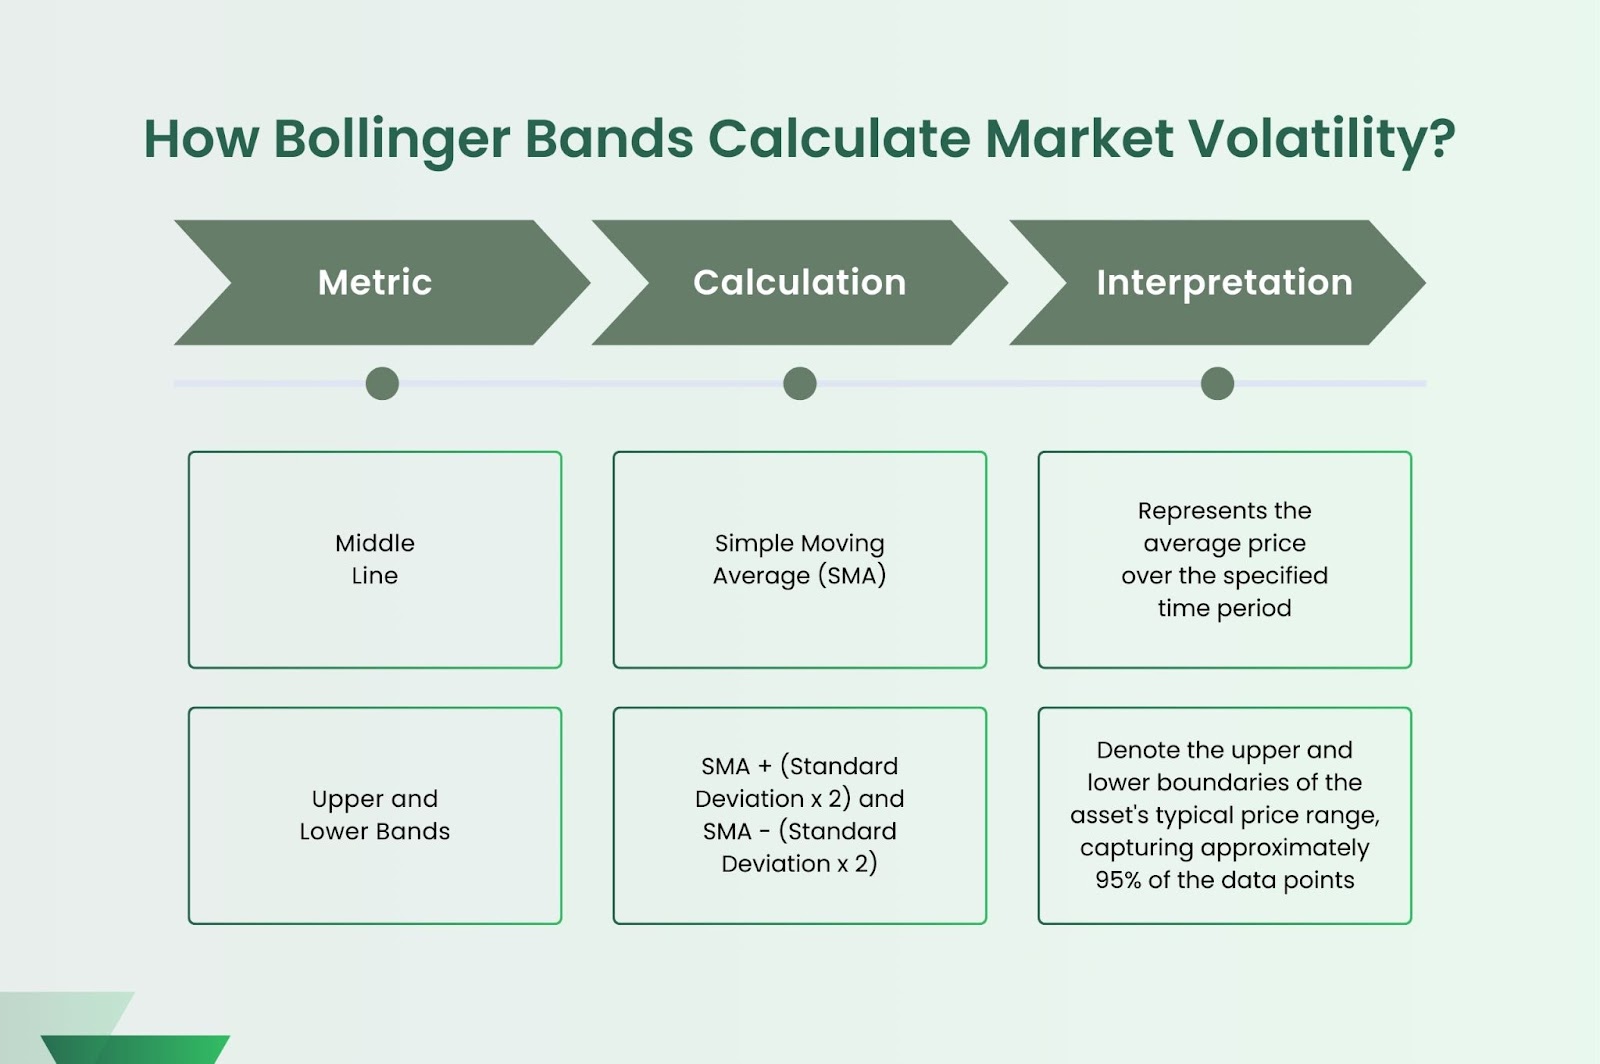
| Metric | Calculation | Interpretation |
| Middle Line | Simple Moving Average (SMA) | Represents the average price over the specified time period |
| Upper and Lower Bands | SMA + (Standard Deviation x 2) and SMA – (Standard Deviation x 2) | Denote the upper and lower boundaries of the asset’s typical price range, capturing approximately 95% of the data points |
The traders will get to understand market volatility from the asset price and Bollinger Bands. Small bands are low volatility, meaning prices tend to be closer; conversely, wide bands express high volatility where prices have further room to fluctuate, making them an opportunity to trade.
Bollinger Bands change with the variations of the market and are adaptive in nature. In other ways, by changing the period, traders can fit this analysis to their style of trading and the market, to understand the behavior of the assets through statistical analysis.
Key Trading Signals Using Bollinger Bands
Bollinger Bands are a powerful tool for traders. It helps in highlighting significant trend reversals, levels of support, resistance, among many more, which makes it easier for investors to make prudent choices.
Bollinger Bounce Strategy
One very popular approach is the “Bollinger Bounce.” This strategy looks for an entry based on when price has tagged or bounced off one of the Bollinger Bands. These bounces might show a pattern in prices and trading signals upon which a trader could base moves to take quick profits.
Bollinger Squeeze Patterns
Another signal quite in use is the “Bollinger Squeeze.” That is when the Bands contract, signaling low volatility. A breakout through this squeeze is often considered an imminent precursor to a big trend reversal, thus giving a good opportunity to take a position in the market.
Double Bottom and Top Formations
Bollinger Bands also help in identifying double bottoms and tops. If the price touches the Bands and then turns back, that might mean a trend reversal or a new support or resistance level.
Mastering these signals of Bollinger Bands can help give investors the edge. It helps to make better, data-driven trading decisions.
Common Trading Errors Using Bollinger Bands
Bollinger Bands can revolutionize the way one operates in the market. At the same time, one should avoid falling into some common pitfalls. A major trading mistake is overdependence on an indicator. This might ultimately lead to false signals with missed opportunities.
Another mistake made is misinterpreting Bollinger Band signals. Some believe that when the bands are touched, a trend reversal is imminent. The market, however, may continue for some time in the same direction. It is very important to manage risks properly in order not to get misled by such false signals.
- Overreliance on Bollinger Bands as the sole trading strategy
- Misinterpreting Bollinger Band signals and assuming an immediate trend reversal
- Failure to combine Bollinger Bands with other technical analysis tools.
- Overtrading based on Bollinger Band signals without effective control of risk.
To overcome such problems, traders should always use Bollinger Bands together with other tools: indications of moving averages or momentum oscillators can strengthen your trading. Besides, proper risk management means setting stop-loss levels and sizing positions. This will help him fight wild markets and prevent overtrading.
“The key to making Bollinger Bands profitable is striking an effective trade-off between leveraging the helpfulness of the indicator with dependence on the same.”.
By overcoming some of these common mistakes and taking a broader view, traders can really benefit from Bollinger Bands. This will improve their results in the market.
Advanced Bollinger Bands Trading Strategies
Investors are not limited to simple Bollinger Bands trading techniques but can go to the more advanced to better their results. In fact, such strategies range from using Bollinger Bands in combination with other tools to taking into consideration different time frames and focusing on volatility.
Multi-Timeframe Analysis
Looking at Bollinger Bands on different time frames helps to better understand the market. It lets traders see when the signals are strong and when they might be wrong. This makes trading more reliable and effective.
Combining with Other Technical Indicators
Trading becomes even better when Bollinger Bands are combined with other indicators, such as RSI or MACD. All these tools combined will enable you to notice when prices are too high or too low, confirm the trend, and provide information on the best time to trade.
Volatility Breakout Trading
Bollinger Bands are excellent to trade when the market is highly volatile. A trader will know the exact time to trade by observing the bands and price action. It will also help him to manage his risk and get better results.
| Advanced Trading Technique | Key Advantages |
| Multi-Timeframe Analysis | Confirmation of trading signals, filtering out false signals |
| Combining with Other Indicators | Enhanced signal identification, trend confirmation, risk management |
| Volatility Breakout Trading | Timing of breakout trades, managing risk during volatile periods |
These advanced Bollinger Bands trading strategies will definitely help a trader in this respect. In other words, skills related to understanding the market and placing winning trades shall be developed over some time. On the other hand, these options can be mixed and matched with various approaches, thus making better and more accurate decisions to augment returns from financial markets.
Real-World Applications Across Different Markets
The Bollinger Bands concept is not solely applied on the stock market but across many other financial markets that include the forex, cryptocurrency markets, and commodity markets, among others. Learning various ways of using them in other markets can strengthen a trading strategy and create an added advantage.
In the forex market, Bollinger Bands help to identify when prices are moving fast and might break out. They help traders see when trends are strong, when to buy or sell, and when to get out. Because the forex market trades all day and has lots of money moving around, traders need to adjust Bollinger Bands to work best.
For cryptocurrency traders, this is where Bollinger Bands come in: an attempt to tame the beasts of digital assets. A trader can find points of volatility, breakouts, and levels of resistance whereby the price might stop or start moving by studying dynamics between the band and prices. Given the very fleet-footed nature of changes in crypto markets, traders also have to adapt Bollinger Bands to suit changes in the mood and, more importantly, news influencing the market.
| Market | Bollinger Bands Considerations |
| Stock Trading | Identifying market trends, spotting overbought/oversold conditions, and timing entries and exits. |
| Forex Market | Analyzing volatility patterns, detecting potential breakout opportunities, and managing risk. |
| Cryptocurrency Trading | Navigating market volatility, identifying consolidation phases, and detecting potential support or resistance levels. |
| Commodity Markets | Monitoring price fluctuations, identifying overbought/oversold conditions, and managing trading positions. |
Bollinger Bands in commodity markets work in a way that enables a trader to understand the fluctuation in prices. It helps the trader in telling where the price might be halted or started and pinpoint prices that are too high or too low. According to the analysis, a trade can be planned, adjusting the Bollinger bands for the commodity that will be traded. Each commodity has its own supply and demand, politics, or seasons affecting it, and its unique characteristics.
This will help the trader to make better choices, manage risks, and improve their trading results using Bollinger Bands in all these markets with good understanding.
Conclusion
Mastering Bollinger Bands can change your trading game. You now know how to use this tool for better understanding the market and making smarter trades.
Knowing how to correctly measure market volatility and also provide trading signals is key in balancing risks and rewards inherent in any trade. Knowing how to use other trading tools in conjunction with the Bollinger Bands gives great insight into market trends.
Continue to hone and perfect your skills at Bollinger Bands; keep dedicating yourself to learning more about trading. With this knowledge, you are well on your way to successful trading and becoming a technical analysis expert.
FAQ
What is Bollinger Bands?
Bollinger Bands are a market analytical tool invented by John Bollinger in the 1980s. They are used to measure volatility and discover support, resistance, and changes in trend.
How do Bollinger Bands work?
Bollinger Bands consist of a middle line and two outer bands. The outer bands are plotted at a standard deviation above and below the middle line. This setup changes with market volatility, showing price and momentum trends.
What are the components of Bollinger Bands?
Bollinger Bands consist of three parts: the middle line, the upper band, and the lower band. Normally, the upper and lower bands are two standard deviations from the middle line. This can be adjusted, though.
How does one trade using Bollinger Bands?
Bollinger Bands are useful for pointing out trading signals, like the Bollinger Bounce strategy and Bollinger Squeeze patterns. They also help find trend reversals and overbought/oversold conditions.
What are some common pitfalls using Bollinger Bands?
Common pitfalls also include over-relying on the indicator and misreading the signals. Equally important, Bollinger Bands should be employed along with other tools as well. Always manage your risk, never overtrade.
How are Bollinger Bands used in more advanced trading strategies?
Advanced techniques, in turn, use Bollinger Bands in combination with other indicators and time frames to crystallize market vision and develop successful trading. Where can Bollinger Bands be applied to different markets? Bollinger Bands work in various markets, including stocks, forex, and cryptocurrencies. While the principles remain the same, strategies need to fit each market’s unique traits.